Reports Hub: Overview of All Analytics
After reading this article you'll know every report in the Reports section — including the Staff and Cost of Goods reports — and which card to open for each question.
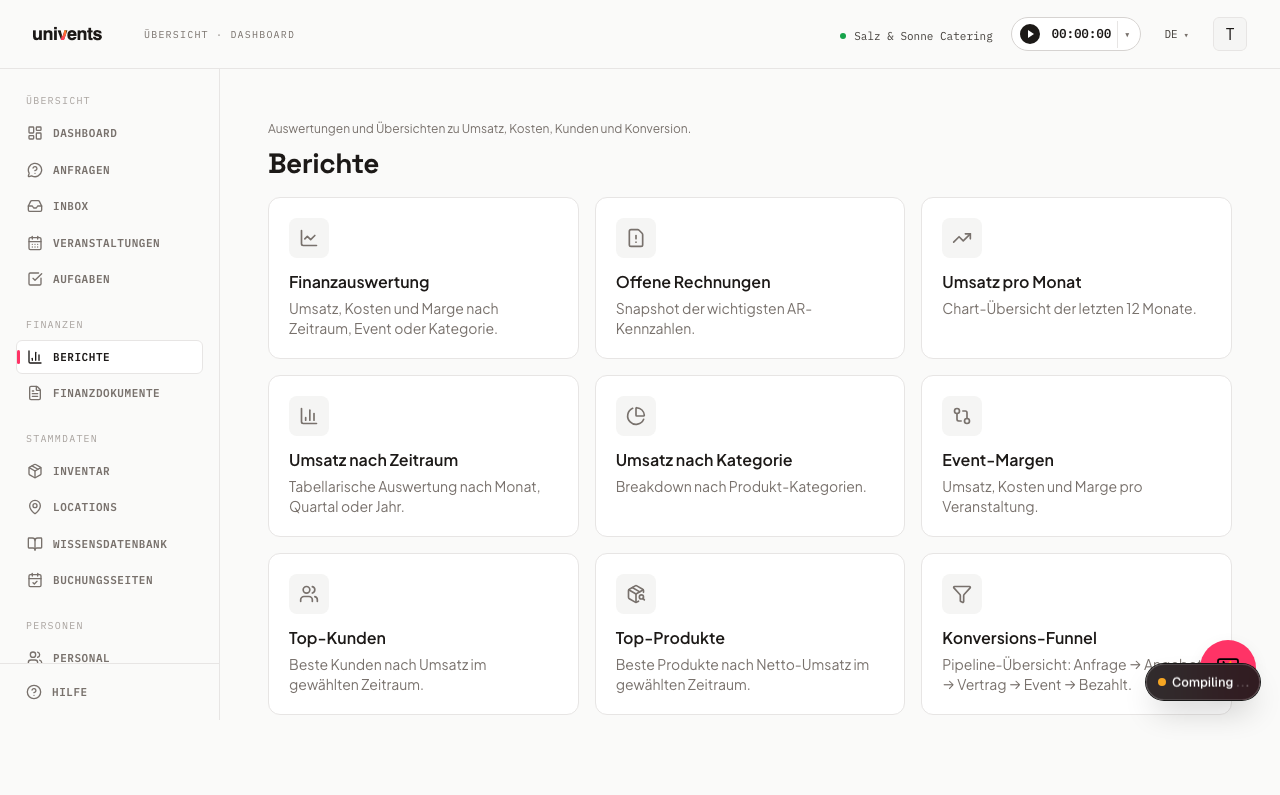
The Reports section in Univents brings together all analytics on revenue, costs, staff, cost of goods, and conversion in one place. From there you navigate directly into the individual reports.
Opening the Reports Hub
- Click Reports in the left navigation.
- You land on the hub with all available report cards.
- Click a card to open the corresponding report.
- Use the Back to reports link to return to the hub from any report.
The Five Areas at a Glance
| Card | What it's for |
|---|---|
| Financial breakdown | Revenue, costs, and margin — groupable by period, category, event, location, customer, or product |
| Outstanding invoices | Snapshot of outstanding receivables, avg. days to payment, and their trend over the last months |
| Booking funnel | Inquiry → quote → accepted, including response times per booking page |
| Staff & working time | Logged working hours and labor cost per staff member |
| Cost of goods | Goods cost per event and the resulting food-cost ratio |
Financial breakdown is the biggest card: at the top you switch between six views using Group by — Period, Category, Event, Location, Customer, and Product. All six share the same date filter; switching the grouping keeps the selected period in place.
Date Filter and Other Filters
Most reports show a date filter in the top right with From and To fields. The default range is usually the current calendar year — only Staff & working time starts with the last 12 months. The page updates immediately without needing to click a button.
Financial breakdown, Staff & working time, and Cost of goods can additionally be narrowed by Location and Tags; the Booking funnel instead filters by individual Booking page.
Nearly every report also has a Views button in the top right: it saves your current combination of date range and filters under a name and reloads it later with a click — handy for breakdowns you need regularly in the same configuration. Saved views only apply to the report they were created in.
Staff and Cost of Goods Reports
Staff & working time shows you, per staff member, the logged hours and the resulting labor cost including night/Sunday/holiday surcharges — the same calculation used in the payroll CSV export. Without access to Finance, you still see hours and headcount, but not the cost columns. Above the rows, Univents summarizes four totals: Total hours, Total labor cost, Staff, and Avg. rate (the last two cost columns only with Finance access). The table below lists, per staff member, the columns Staff, Hours, Labor cost, Avg. rate, and Entries.
Cost of goods compares the goods cost per event against the event's revenue and calculates the food-cost ratio from that. It's based on the purchase prices stored on your products plus confirmed or delivered supplier orders. Without a purchase price on the product, the row stays empty. Three summary tiles show Total cost of goods, Total revenue, and the Food-cost ratio; the table below lists, per event, the columns Event, Cost of goods, Revenue, Food-cost %, and Orders.
For staff scheduling itself — assigning shifts, keeping an eye on live labor cost — use the Disposition Board.
The Booking Funnel in Detail
The Booking funnel tracks how many views of your booking pages ultimately turn into an accepted quote — from Views through Form started, Inquiries, Quote created, and Quote sent, all the way to Quote accepted — including the response time between stages. A separate table breaks the same numbers down per booking page.
For the full details on every stage, the response-time metrics, and the "By booking page" table, see Booking Funnel: From View to Deal.
Outstanding Invoices and Operational Finance Documents
The Outstanding invoices card shows a snapshot: Outstanding receivables (now) (including the overdue portion) and the Avg. days to payment, followed by the Aging trend over the last months. For day-to-day work — filtering, searching, sending reminders, and marking invoices as paid — switch to the full documents view using the Open finance documents button.
Exporting Reports as an Excel File
Financial breakdown, Booking funnel, and Staff & working time have an Excel export button in the top right: it downloads the currently displayed report, matching your active filters, as an XLSX file.
Frequently Asked Questions
Which report do I use for the monthly close? Open Financial breakdown, leave Group by on Period, and pick the Month grouping below it — you get revenue, costs, and margin per month in a single table.
I want to know which events have the lowest margin. Open Financial breakdown, set Group by to Event, set the desired period, and sort the table by the Margin % column.
Where can I see how well my booking pages convert? The Booking funnel shows, per booking page, how many views turn into started forms, inquiries, sent quotes, and accepted quotes — including the time that passes between each stage.
Can I export reports? For Financial breakdown, Booking funnel, and Staff & working time, yes — via the Excel export button in the top right. Outstanding invoices and Cost of goods can't be exported directly yet; for data export there, use the table views in Finance Documents.