Revenue by Category
After reading this, you'll be able to use the Revenue by Category report to see — for any date range — which product categories contributed how much revenue, costs, and margin.
The Revenue by Category report shows you, for any date range you choose, which product categories in your catalogue generated revenue, costs, and margin. At a glance you can see which parts of your offering are most profitable and where there is room for improvement.
Opening the report
This report is now part of Financial breakdown — there is no separate card for it in the Reports hub anymore. If you open an old link to this page, Univents automatically redirects you to the right view.
- Navigate to Reports in the left sidebar.
- Click the Financial breakdown card.
- In the Group by bar, select the Category view.
- The report loads automatically with the current calendar year as the default date range.
Adjusting the date range
In the upper right of the report you will find the date fields From and To. Enter the dates you want or pick them using the date picker. The table updates immediately — no separate button press is needed.
The default date range when you open the report always covers the current calendar year (1 January to 31 December).
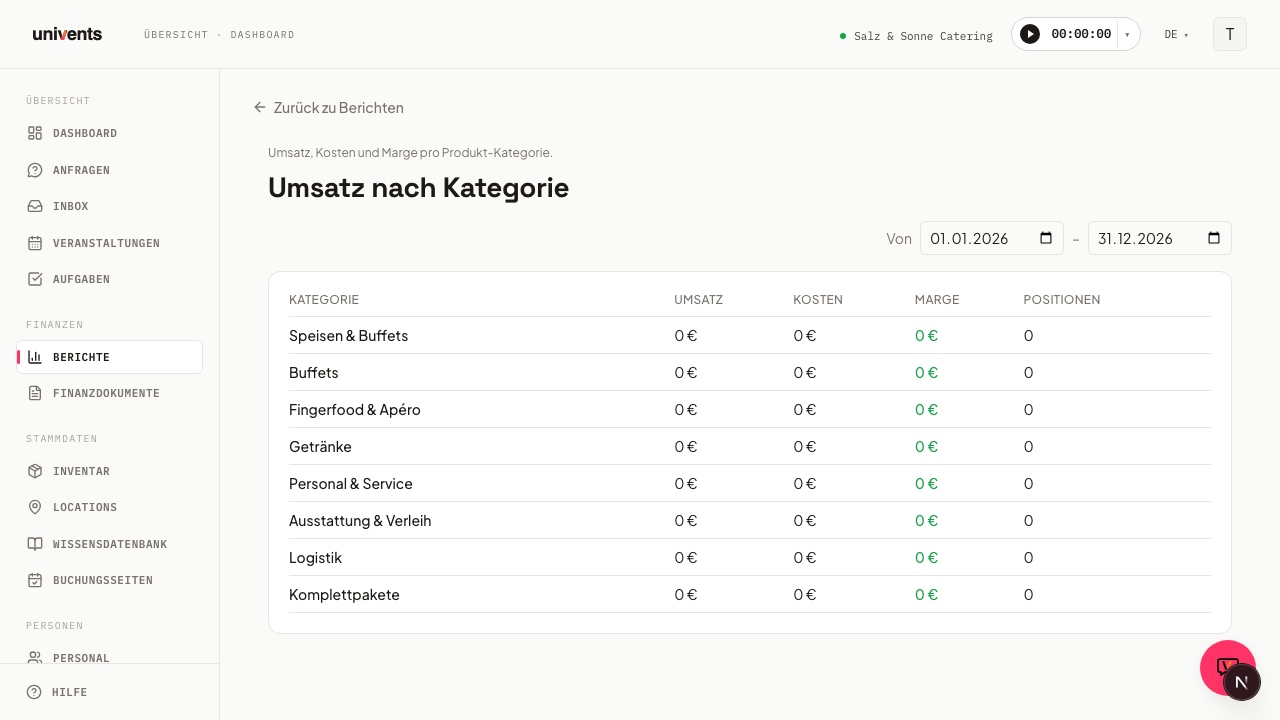
Understanding the table
The results table contains one row per product category with the following columns:
- Category — The name of the product category as stored in your product master data.
- Revenue — Net revenue of all line items in this category within the selected date range.
- Costs — Net costs of the associated line items.
- Margin — The difference between revenue and costs. Positive values are highlighted in green, negative values in red.
- Items — The number of individual billed line items included in the calculation.
All amounts are in euros (net), rounded to whole euro amounts.
No data visible
If the message No data for the selected period appears, there are two common causes:
- The selected date range contains no billed line items with an assigned category.
- Some line items have no product category assigned and therefore do not appear in this report. In that case, review your product master data and assign the missing categories.
Tips
- Keep categories tidy: The more carefully products are organised into categories, the more meaningful this report becomes. Products without a category do not appear.
- Year-over-year comparison: Set the same date range for two different years and compare the results manually to spot trends.
- Combine with the Event view: In the Financial breakdown, switch Group by to the Event view to also see profitability per event.
- Export: In the top right of the report you'll find the Excel export button — it downloads the category breakdown, including your active filters (date range, location, tags, etc.), as an Excel file.
- Back to the overview: Use the Back to reports link in the upper left to return directly to the reports overview.