Revenue by Period (Month/Quarter/Year)
After reading this, you'll be able to pull your net revenue, costs, and margin for any date range broken down by month, quarter, or year, and export it to Excel.
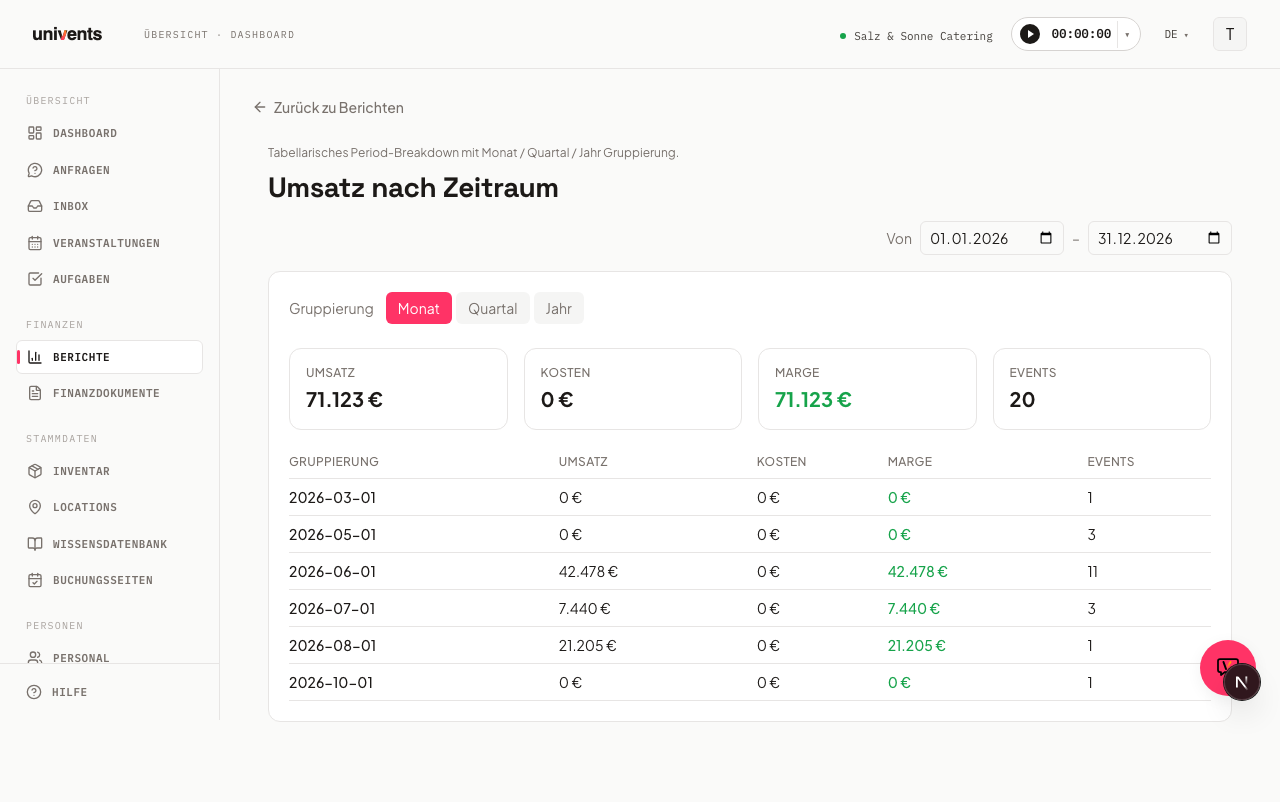
The Revenue by Period report gives you a tabular overview of your revenue, costs, and margin — grouped by month, quarter, or year. You'll find it as the Period view inside Financial breakdown. At a glance you can see which periods were particularly strong or weak.
Opening the report
- Navigate to Reports in the left-hand menu.
- Click the Financial breakdown card.
The report opens by default in the Period view — shown as the highlighted button in the Group by bar at the top of the report — with the current calendar year as the default date range and Month as the default grouping. Use Group by to switch to Category, Event, Location, Customer, or Product whenever you need to; your selected date range stays in place.
Adjusting the date range
In the top-right corner of the report you'll find two date fields — From and To.
- Click the From field and select a start date.
- Click the field next to the separator (To) and select an end date.
The view updates immediately as soon as you change a date. The selected range is preserved when you switch between groupings.
Changing the grouping
Directly above the summary cards you'll see three buttons next to the Grouping label: Month, Quarter, and Year.
- Month — each row represents one calendar month
- Quarter — each row covers three months (Q1–Q4)
- Year — one row per calendar year (useful for ranges spanning multiple years)
Click the desired button; the active grouping is highlighted.
Understanding the metrics
Below the grouping selector, Univents displays four summary cards covering the entire selected period:
| Metric | Meaning |
|---|---|
| Revenue | Net income from finalized documents within the selected period |
| Costs | Net expenses in the same period |
| Margin | Revenue minus costs (green = positive, red = negative) |
| Events | Number of events included in the calculation |
The table below shows the same four columns for each period row, so you can pinpoint which month, quarter, or year an anomaly occurred in. The first column of the table is headed Grouping and displays the period label.
Saving, comparing, and filtering further
In the top right of the report you have three more tools available:
- Views — saves the current combination of date range, grouping, and filters under a name you can reload later with a click.
- Filter — opens a panel with date basis (document or event date — this changes which documents fall into which period), status, location, customer, tags, and guest count.
- vs prior period — adds the percentage difference against the immediately preceding period of equal length to every summary card.
These three tools belong to Financial breakdown and work identically across all its views. For a detailed description of each individual filter, see Financial breakdown by period, event & category.
Frequently asked questions
Why are certain periods empty? The message "No data for the selected period" appears when there are no finalized documents within the chosen date range. Check that the date range is set correctly and that the relevant invoices have already been posted.
Which documents are included in the calculation? The calculation takes into account posted invoices and credit notes. Quotes and drafts are not included.
Can I export the report? Yes. In the top-right corner of the report you'll find the Excel export button (download icon). It downloads the currently displayed table, including your active filters — date range, grouping, and location/tags if set — as an XLSX file.
How does this report differ from the Financial breakdown? These aren't two separate reports anymore: Revenue by Period is the Period view inside Financial breakdown, and it's shown by default when you open the report. To break the numbers down by category, event, location, customer, or product instead, switch views using Group by at the top — your selected date range carries over. For more, see Financial breakdown by period, event & category.