

Financial Report by Period, Event & Category
After reading this article you will know how to switch between the six views — Period, Category, Event, Location, Customer, and Product — in the Financial breakdown report, set the date filter, and correctly read the revenue, cost, and margin figures.
The Financial breakdown report brings revenue, costs, and margin together in one place. Use the Group by bar to switch between six views of the same date range: Period, Category, Event, Location, Customer, and Product.
The video shows how an event’s revenue, planned costs, actual spending and margin come together — and how you then read the same figures across all events in the financial analysis.
You’ll find the individual steps written out below as well.
Opening the report
- Click Reports in the left navigation.
- Click the Financial breakdown card.
The report opens by default in the Period view — shown as the highlighted button in the Group by bar — and displays the current calendar year.
Setting the date range
The date filter applies to all six views at once — switching views does not change the selected date range.
- Change the date in the From field to your desired start date.
- Change the date in the To field to your desired end date.
The page refreshes immediately after each field is changed.
Saving views
To the right, above the table, you'll find the Views button (bookmark icon). It saves your current combination of date range, grouping, and filters under a name you choose — handy for breakdowns you need regularly in the same configuration, for example "Q1, Location Alte Halle only."
- Set the date range, view, and filters the way you want them.
- Click Views and type a name into the text field.
- Click the plus icon to save the view.
Saved views appear in the same list. Clicking a name immediately re-applies that saved combination; the trash icon next to it deletes it. Views are saved per report and only apply to Financial breakdown.
Setting additional filters
The Filter button opens a panel with additional narrowing options that apply on top of the date range. A number on the button shows how many filters are currently active.
- Date basis — determines whether From and To apply to the document date (when the invoice, quote, etc. was created) or the event date. This isn't a minor detail: on document date, an event counts in the month its invoice was written; on event date, it counts in the month the event actually took place. If there's a gap between the event and the invoice — say the invoice is only written the following month — the same event lands in a different period depending on this setting, and revenue, costs, and margin shift accordingly.
- Status — narrows to one or more event states, for example only Confirmed or only Completed.
- Location — filters to a single venue.
- Customer — search your contacts (type at least two characters) and pick one to narrow the report to a single customer.
- Tags — filters to one or more event tags.
- Guests — narrows to a guest-count range (min/max).
Click Apply to apply the filters, or Reset to clear all of them at once. This filter panel is only available in the Period, Category, Event, and Location views — it's hidden for Customer and Product (see below).
Comparing against the previous period
Next to the filter button you'll find the vs prior period button. Turning it on adds a small percentage figure with an arrow icon to every summary card: a green up arrow means an improvement over the immediately preceding period of equal length, a red down arrow means it got worse. For costs, the color logic is reversed — a decrease in costs counts as an improvement there.
This comparison is also only available in the Period, Category, Event, and Location views.
Switching between views
Above the table you'll find the Group by bar with six buttons: Period, Category, Event, Location, Customer, and Product. Click a button to switch the table below to that view — your selected date range is preserved.
For Customer and Product, Univents hides the comparison with the previous period as well as the location/tag filters: these two views show a fixed ranking (Top 20) rather than a time series, so those filters wouldn't apply.
"Period" view
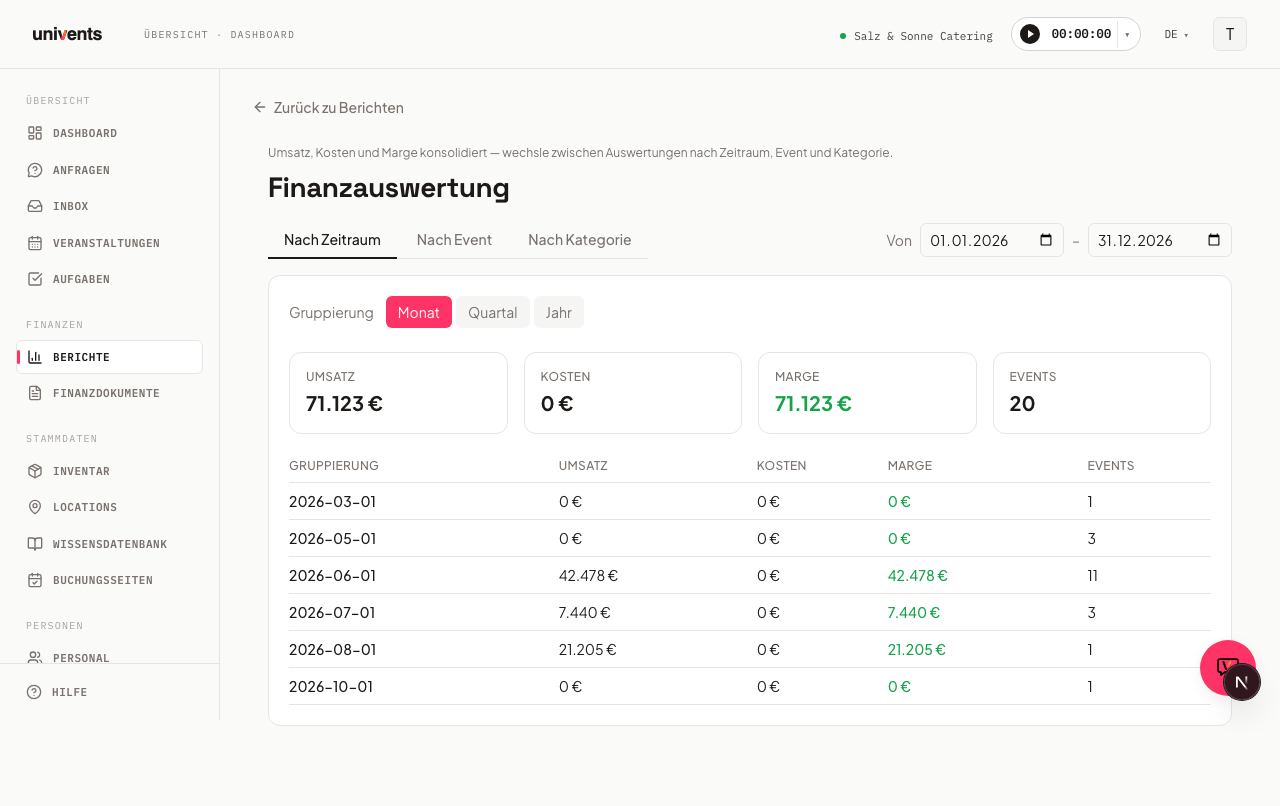
This view shows revenue, costs, margin, and the number of events as summary cards, with a detailed breakdown table below.
Use the Month, Quarter, and Year buttons (under the Grouping label) to control how finely the time range is divided. The table columns are:
- Period — month, quarter, or year
- Revenue — net revenue for the period
- Costs — net costs
- Margin — the difference between revenue and costs; a negative value appears in red
- Events — number of events included in the period
"Category" view
This view breaks the figures down by product category. The table columns are Category, Revenue, Costs, Margin, and Items (the number of line items billed in that category). This view is useful for seeing which service groups (e.g. catering, staffing, technical equipment) contribute most to your margin.
"Event" view
This view lists each event within the selected date range alongside its individual figures. The table includes the columns Event, Date, Contact, Revenue, Costs, Margin, Margin %, and Status. Three summary cards at the top show Total revenue, Total costs, and Total margin as totals across all listed events.
Negative margins are highlighted in red and positive ones in green — making it easy to spot loss-making events at a glance.
"Location" view
This view shows revenue and utilization per venue. The columns are Location, Capacity, Events, Guests, Utilization, Realized, and Pipeline. Utilization is the average guest count relative to the venue's stored capacity; values above 100% usually indicate a missing or too-low capacity value on the venue record.
"Customer" view
This view shows up to 20 of your highest-revenue customers in the selected period, sorted by gross revenue from invoices minus credit notes. The columns are #, Customer, Revenue, and Invoices. For more detail, see Top Customers by Revenue.
"Product" view
This view shows up to 20 of your highest-revenue products in the selected period, sorted by net revenue from invoice line items. The columns are #, Product, Revenue, Quantity, and Documents. For more detail, see Top Products by Net Revenue.
Frequently asked questions
Why do I see "No data for the selected period"? Either there are no events in the selected date range, or no financial documents with line items have been created yet. Adjust the date filter or check whether invoices or quotes are linked to your events.
Do From and To also apply in the other views? Yes. The date filter is shared across all six views. Switching views automatically carries over the currently selected dates.
What exactly does "Margin" mean here? Margin = net revenue minus net costs. All amounts are shown excluding VAT.
Why do my numbers change when I switch between document date and event date? Because both options use a different point in time for the same event: document date counts when the invoice or quote was created, event date counts when the event actually took place. If there's a gap between the event and the invoicing — for example because the invoice is only written the following month — the same event falls into a different period depending on this setting.
Why don't I see a comparison with the previous period for Customer and Product? These two views show a fixed Top-20 ranking rather than a time series. The comparison with the previous period, as well as the location/tag filters, are intentionally hidden there.
Can I export the tables? Yes. Above the table, on the top right, you'll find the Excel export button — it downloads the data for the currently displayed view, including your active filters (date range, location, tags, etc.), as an Excel file.