

Reports & analytics for catering: plan without an AI black box
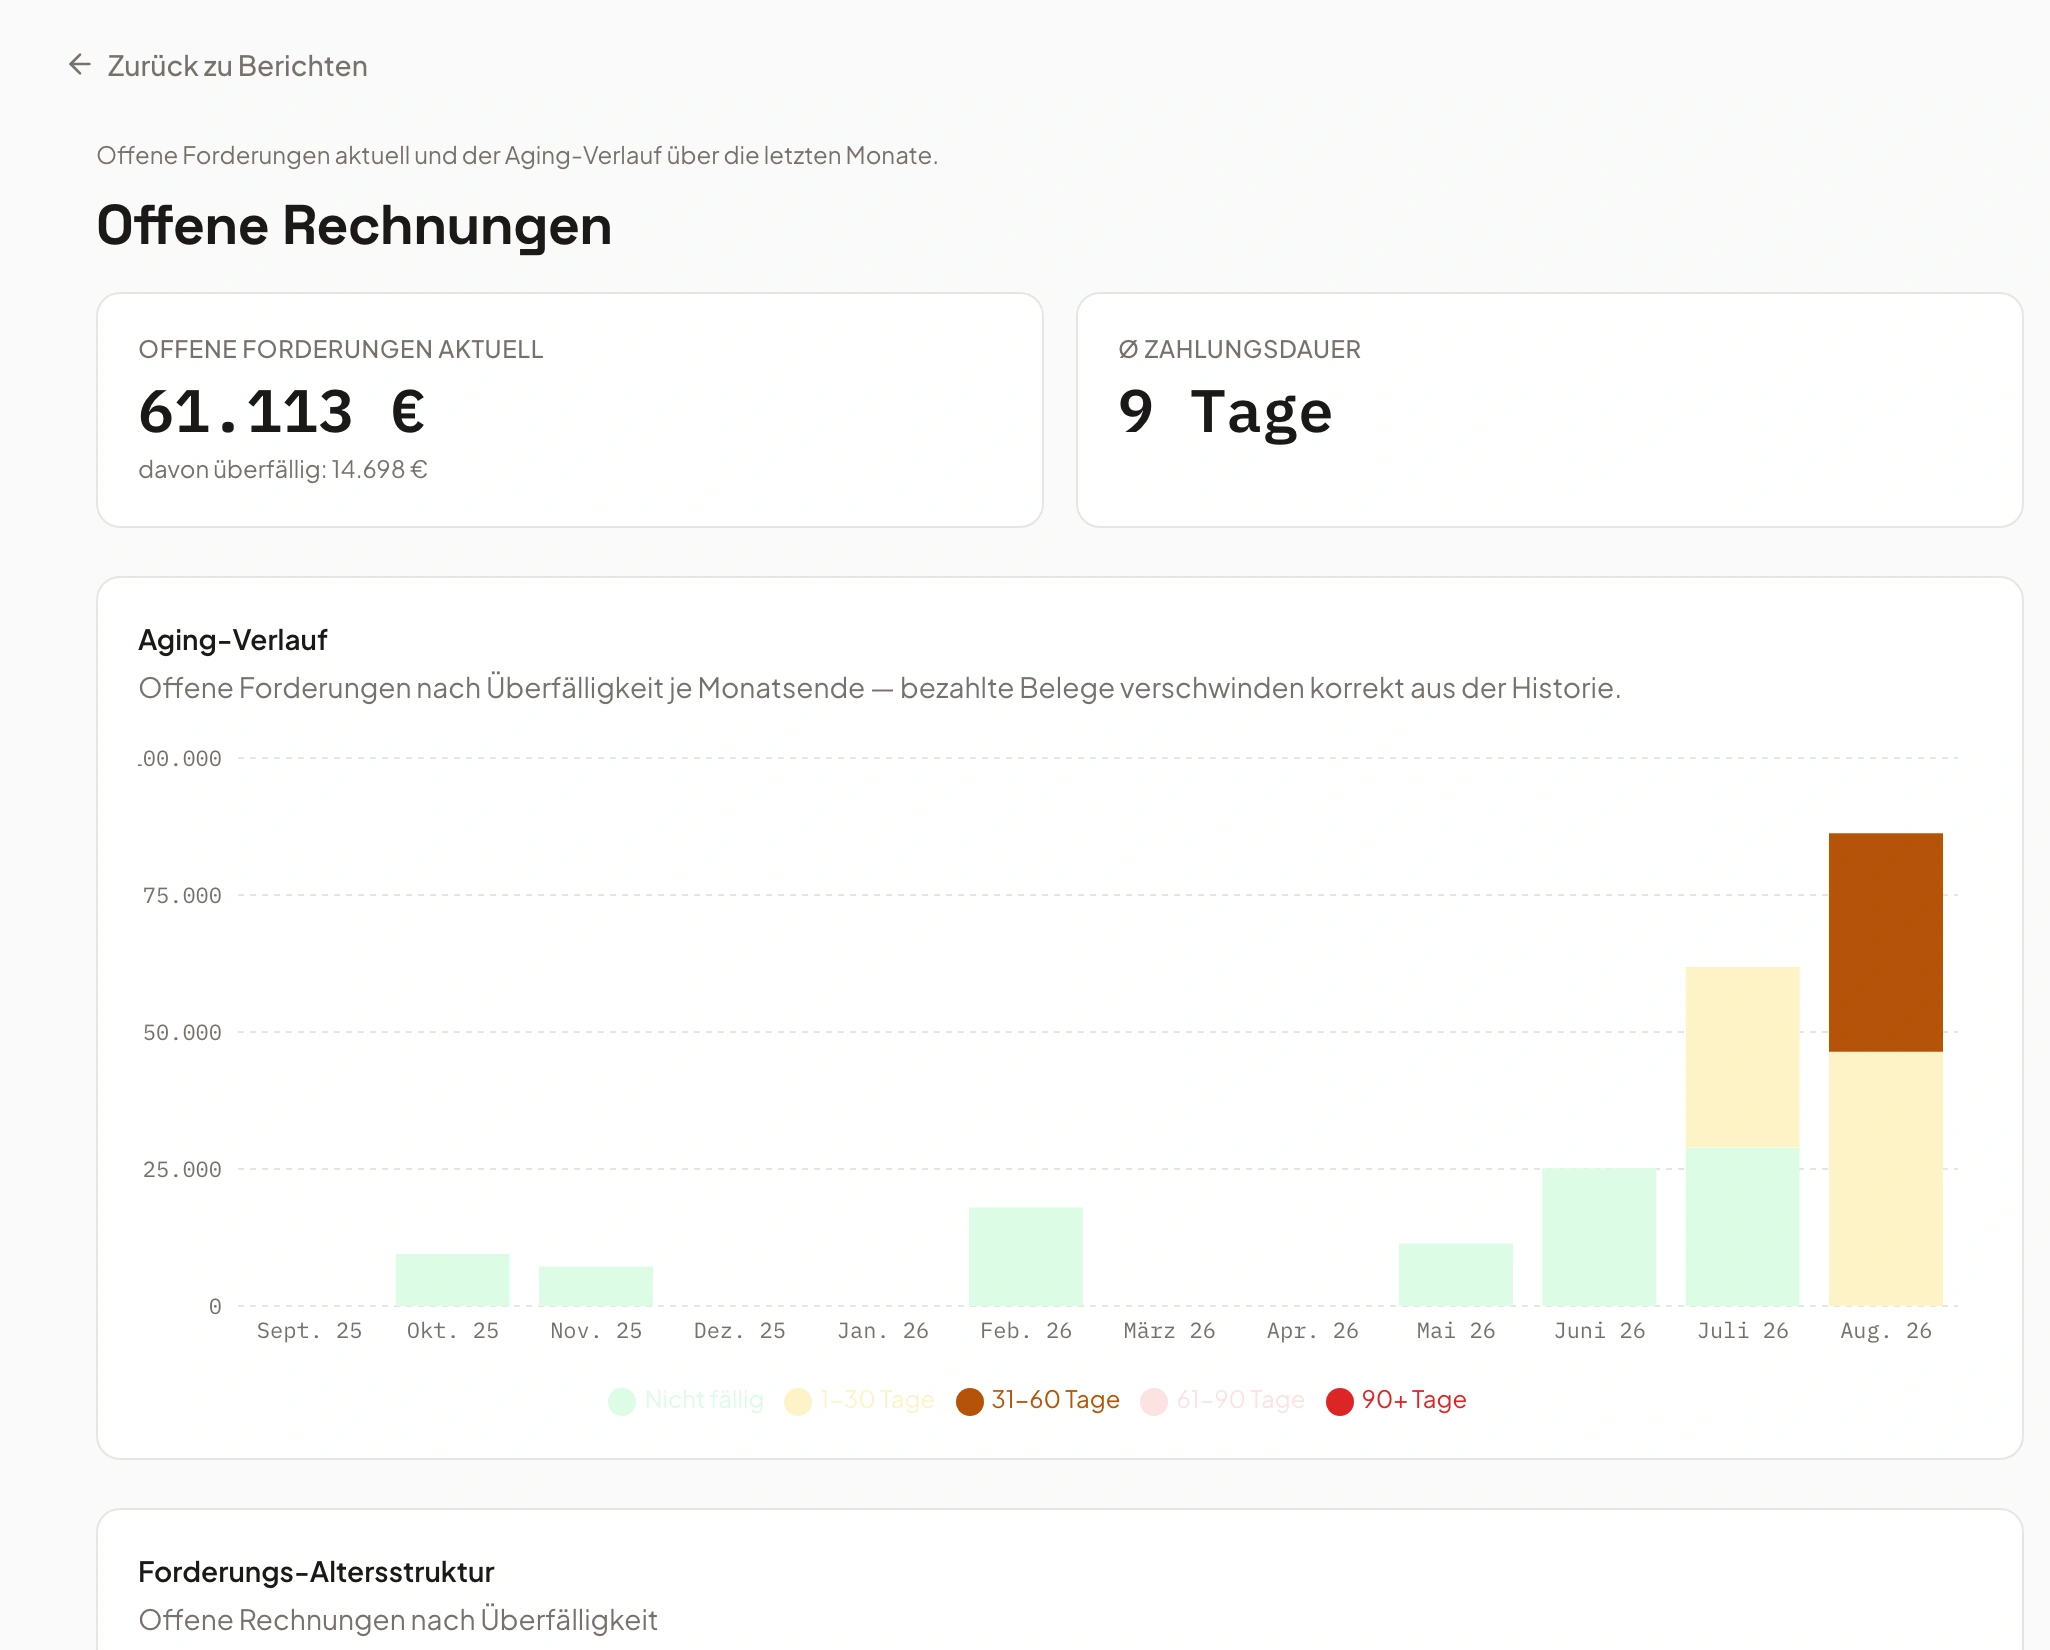
Univents automatically evaluates every booking, invoice and shift: revenue, margins, top customers and food cost at a glance. The post-event numbers for past events show you how much staff and stock an event really needed – you turn that into your own planning rule for the next one.
7-day free trial · no credit card · live in minutes
- Hotel Sonnblick€14,994Regular
- Café Lindenhof€9,996Growing
From reporting to the next plan
Three steps from day-to-day event work to reliable staff and quantity planning.
Events flow into the reports automatically
Every booking, quote, invoice and shift feeds the cockpit automatically – no separate data entry.
No more manual spreadsheet work.
Evaluate revenue, margin and food cost
Revenue reports compared over time, event margins and food cost per event show which events are actually worth it.
Calculation and reality compared at a glance.
Turn post-event numbers into your own planning rule
Compare planned against actual staff and stock use for past events in the report – and derive your own rule of thumb for the next plan.
Planning rules from your own experience, not a forecasting model.
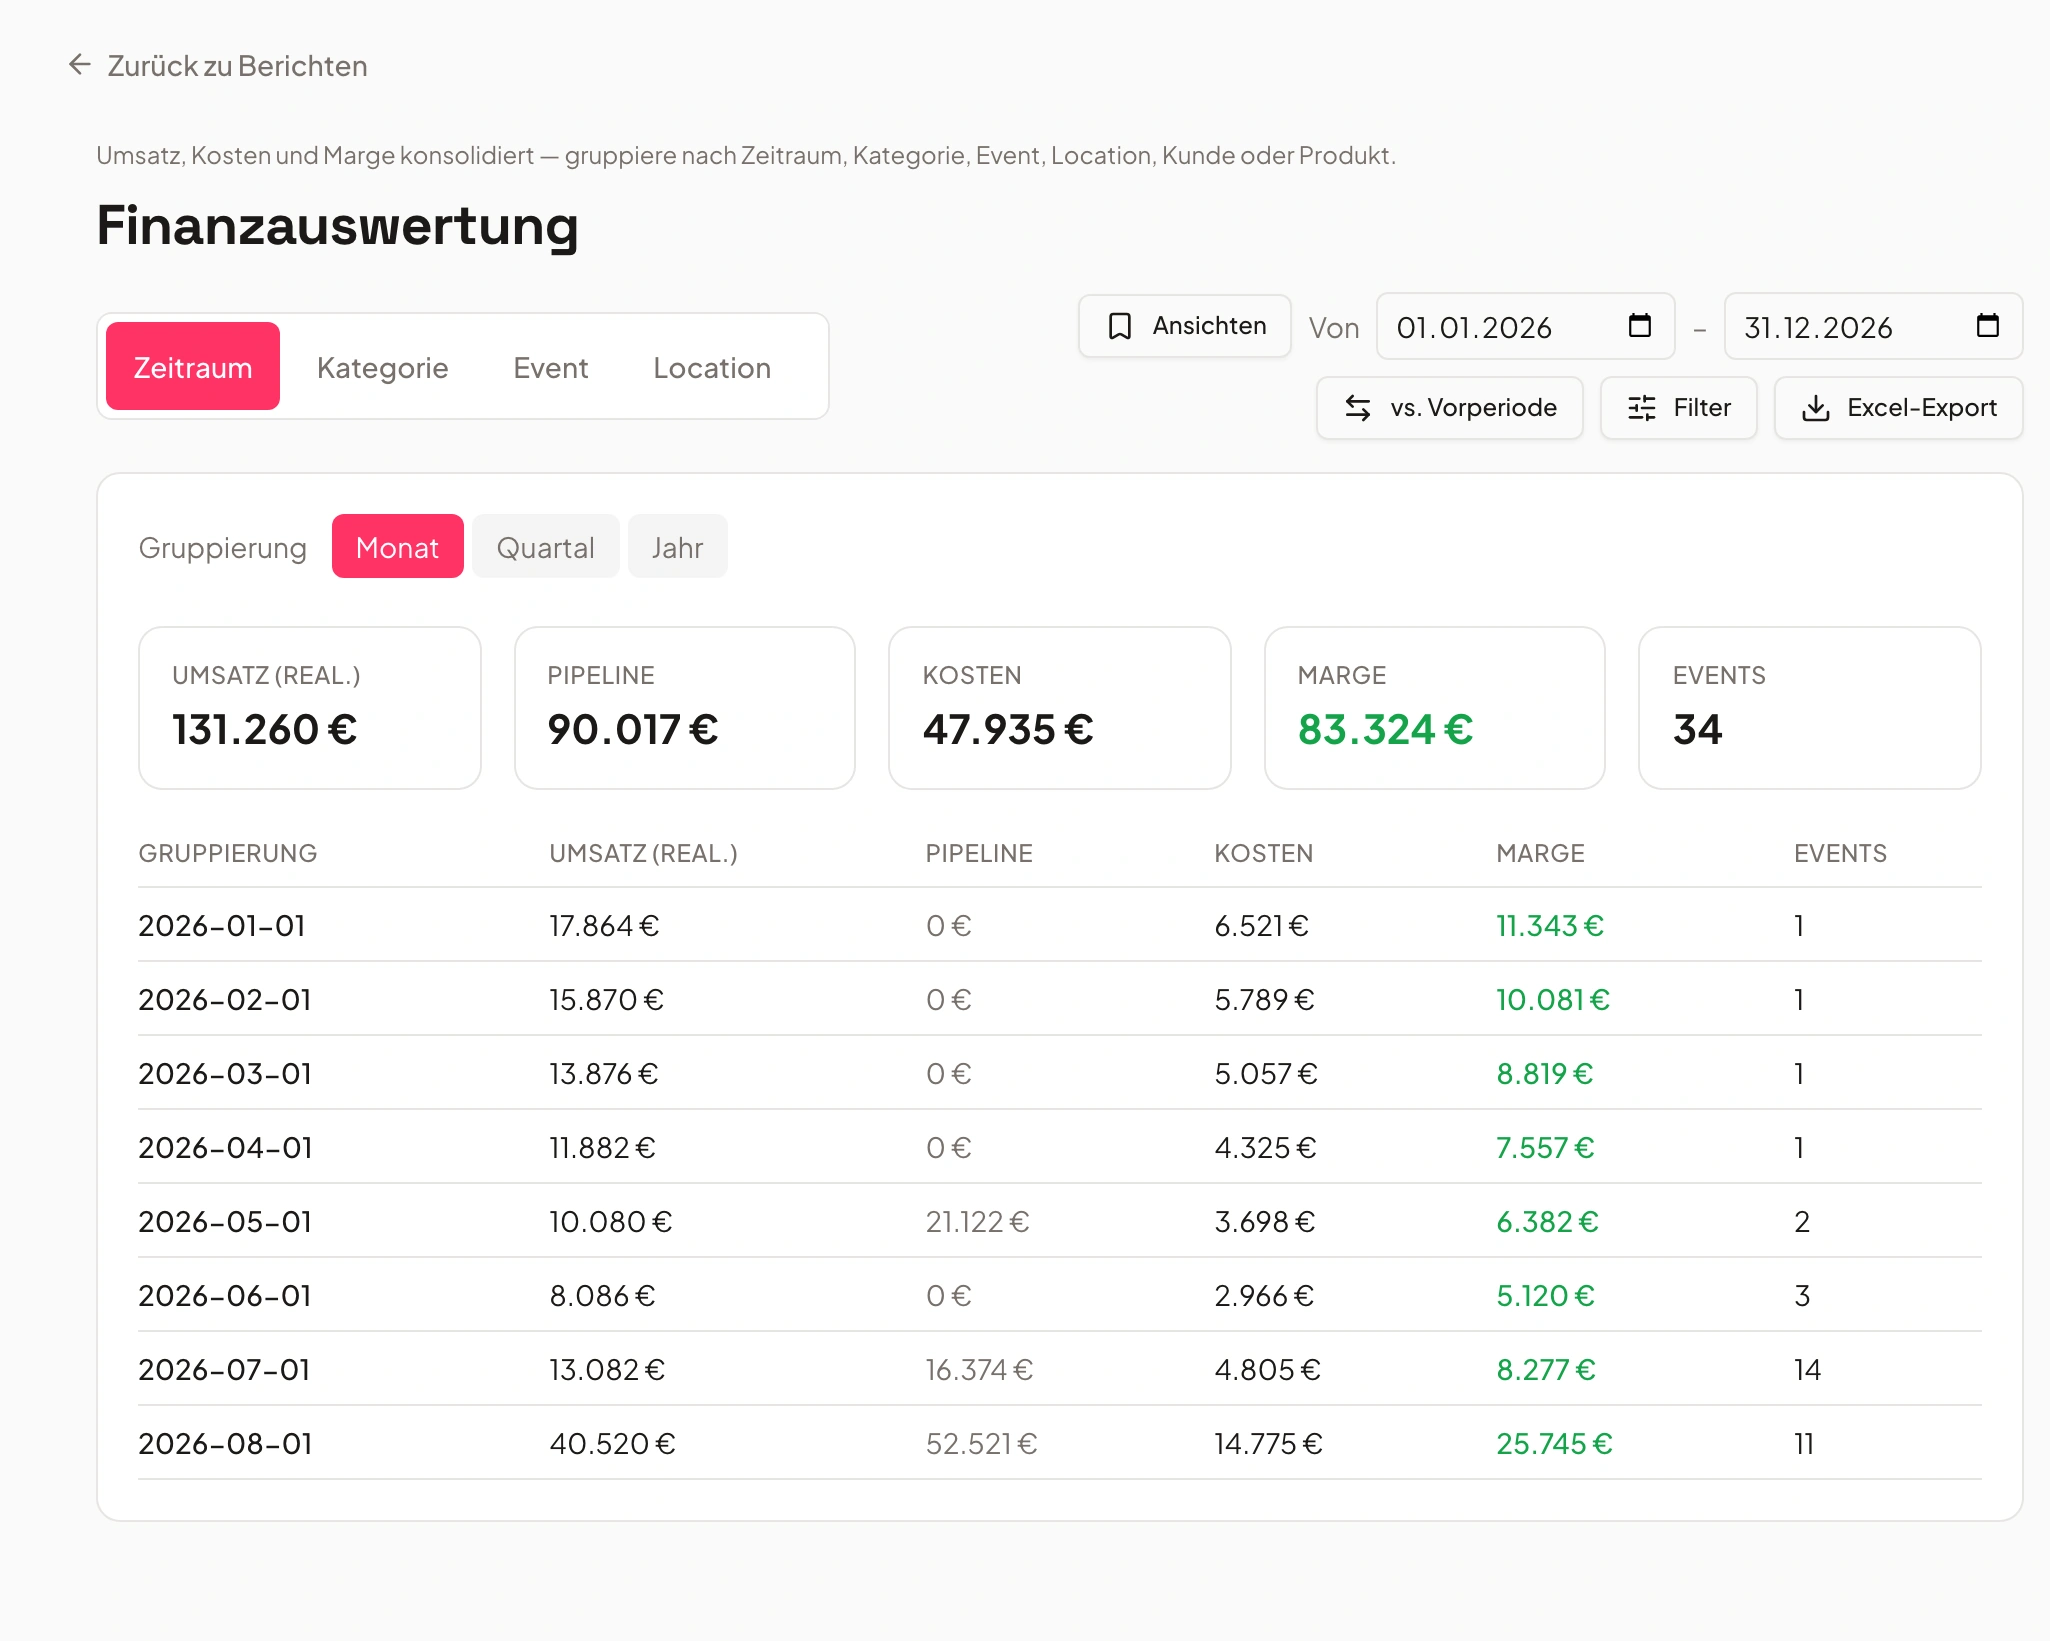
Revenue and margin reports per event
See instantly what an event actually earns.
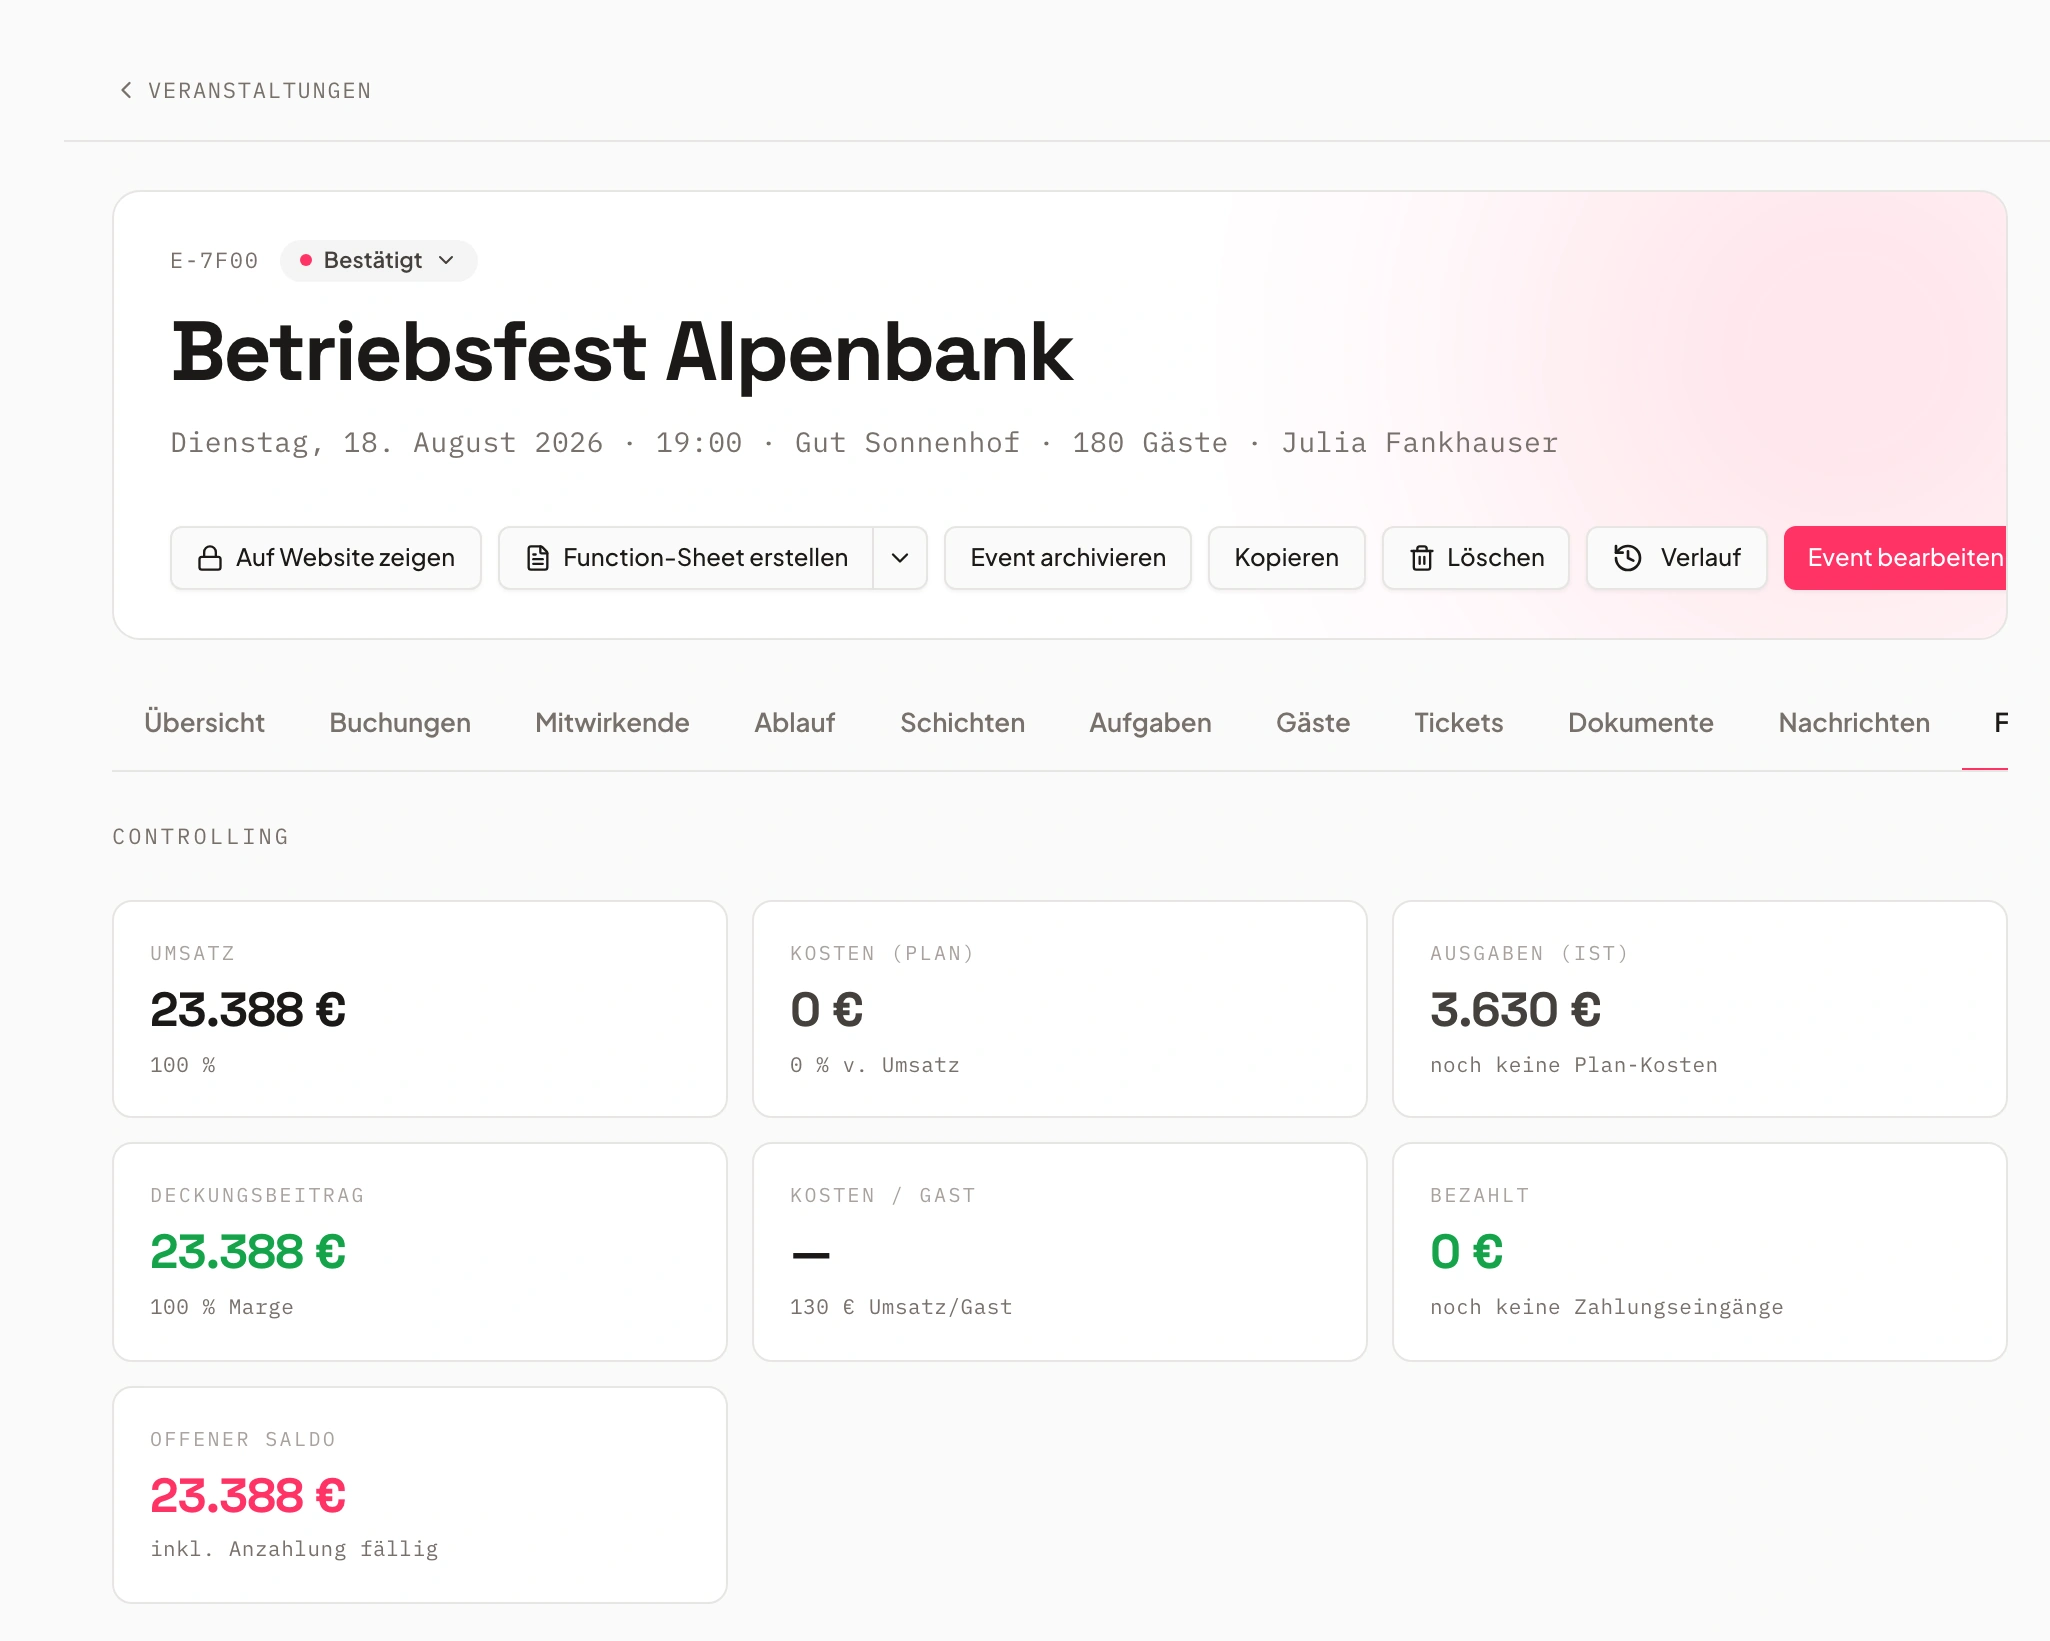
Revenue reports compare periods, and the event margin report shows the contribution margin per event – based on real booking data, not estimates.
So you can see at a glance which event types pay off and where margins are under pressure.
- Compare revenue by period
- Contribution margin per event
- Straight from real booking data
Top-customer report for prioritization
Your most important customers at a glance.
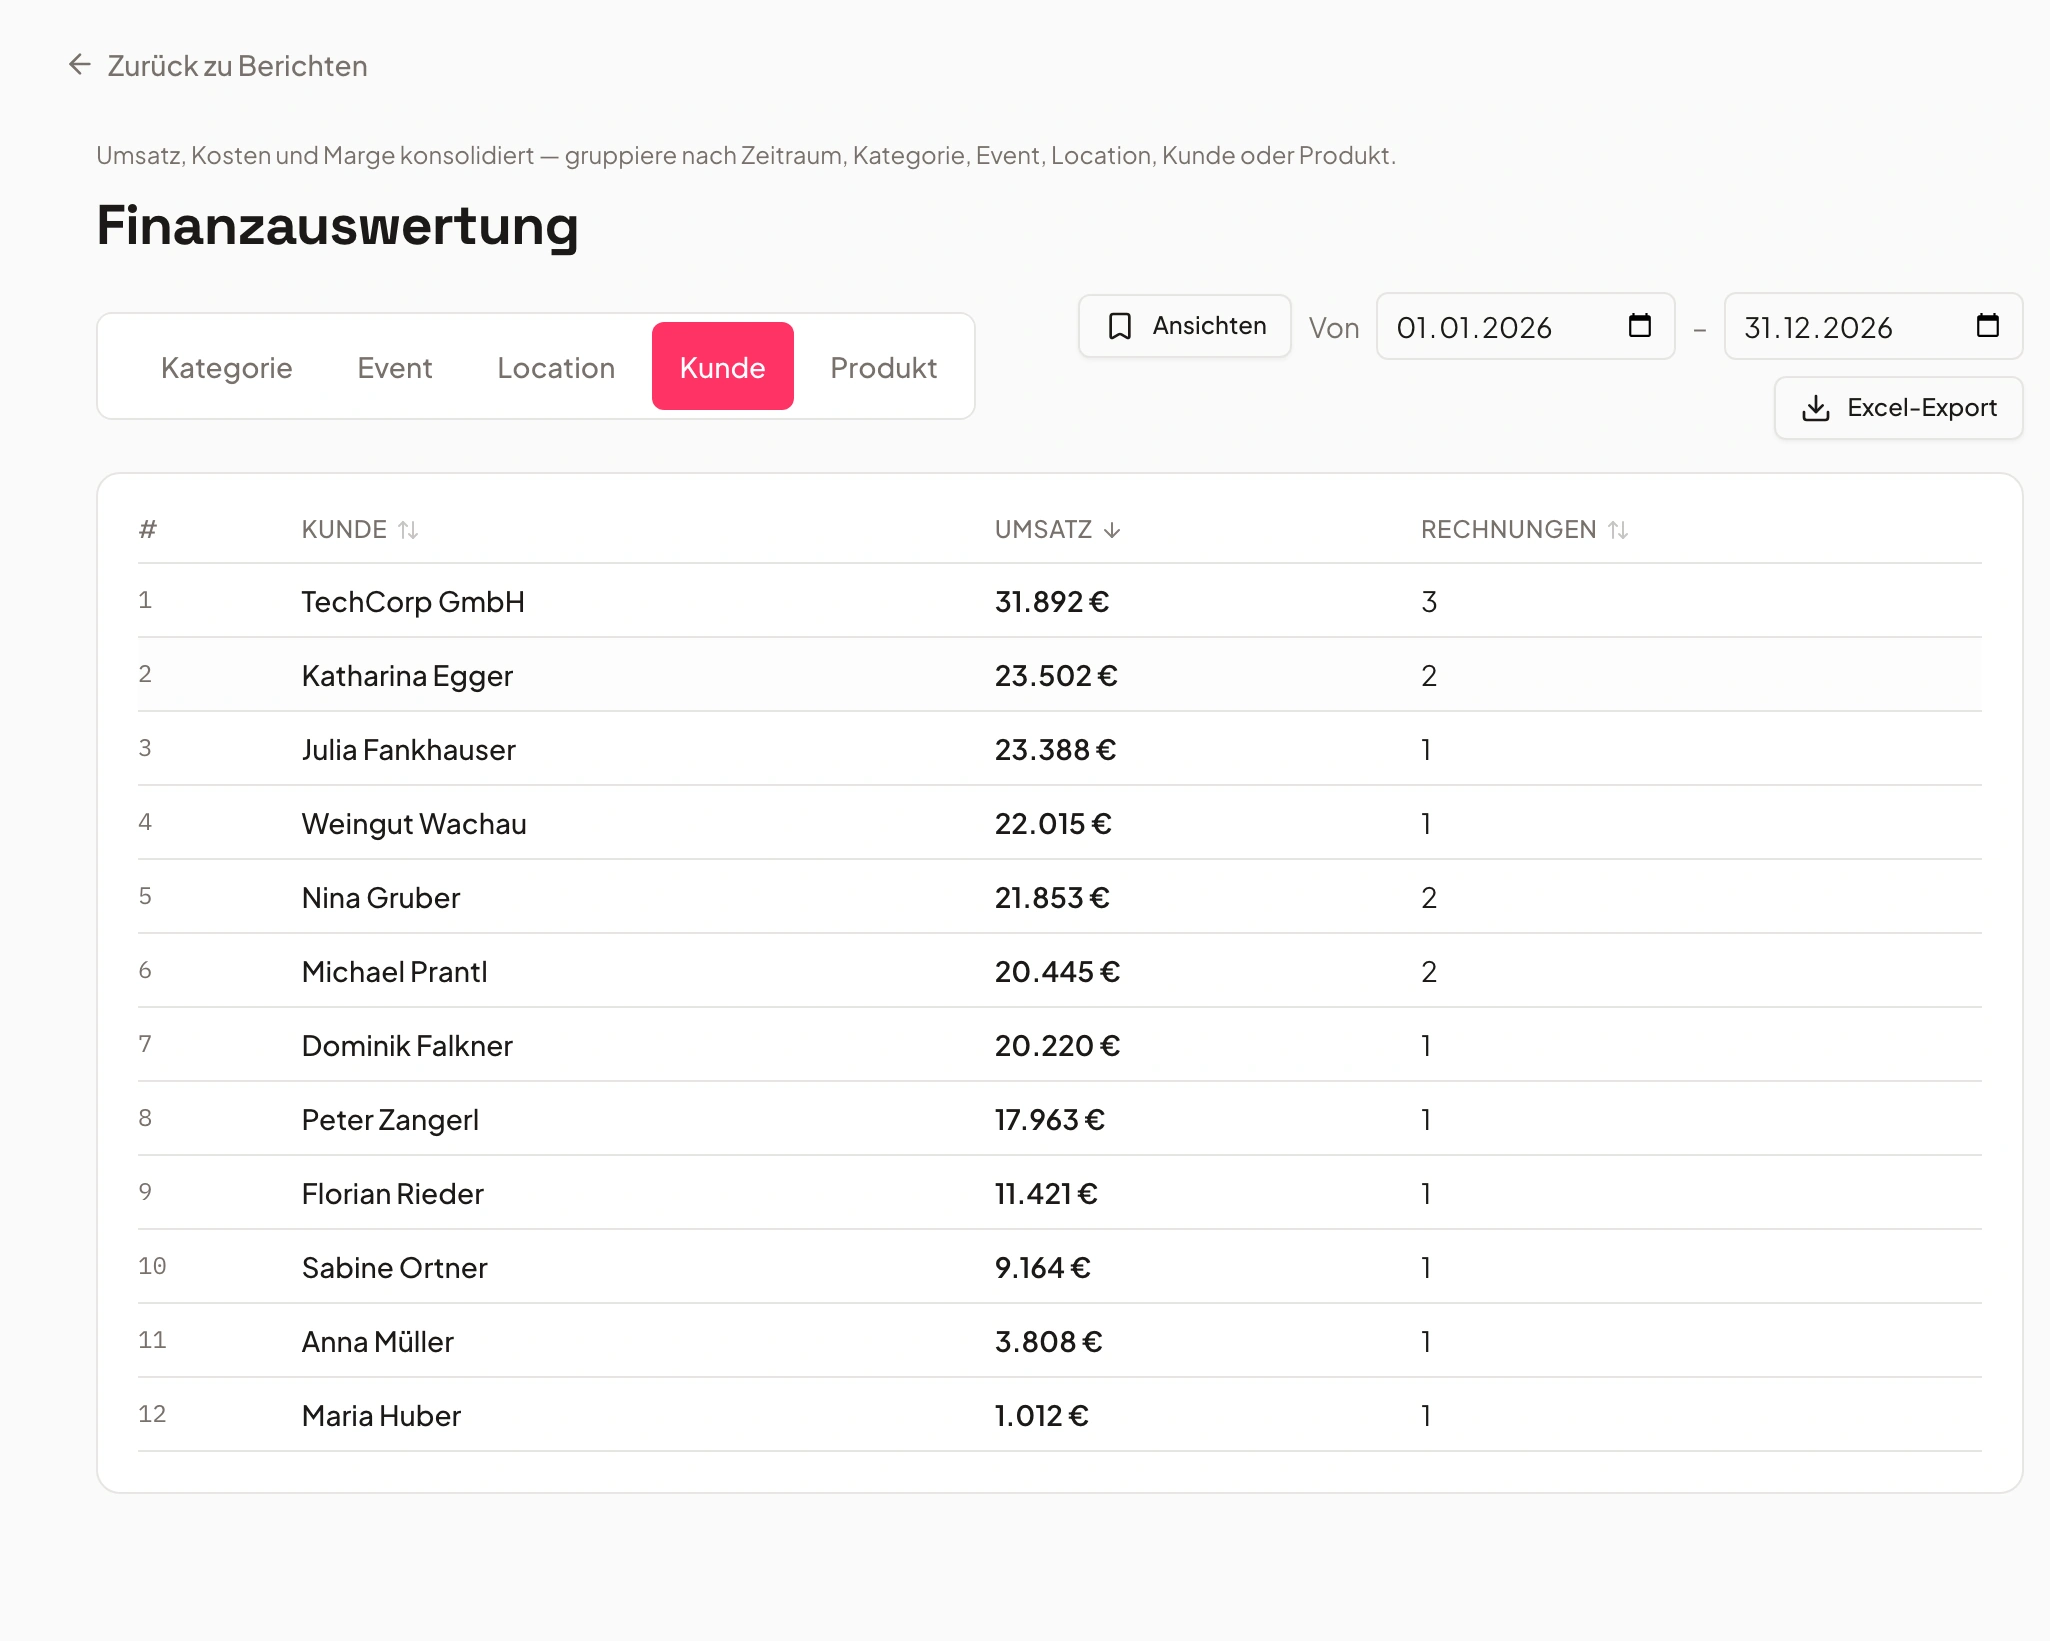
The top-customer report shows who brings in the most revenue over a given period – the basis for sales prioritization and capacity planning.
Combined with the cockpit, you see immediately whether a customer is growing or slipping away.
- Revenue per customer over time
- Basis for sales prioritization
- No manual spreadsheet work
- Hotel Sonnblick€14,994Regular
- Café Lindenhof€9,996Growing
- Frisch & Feierlich GmbH€1,726New
Food-cost report & contribution margin statement
A calculation that still holds up after the event.
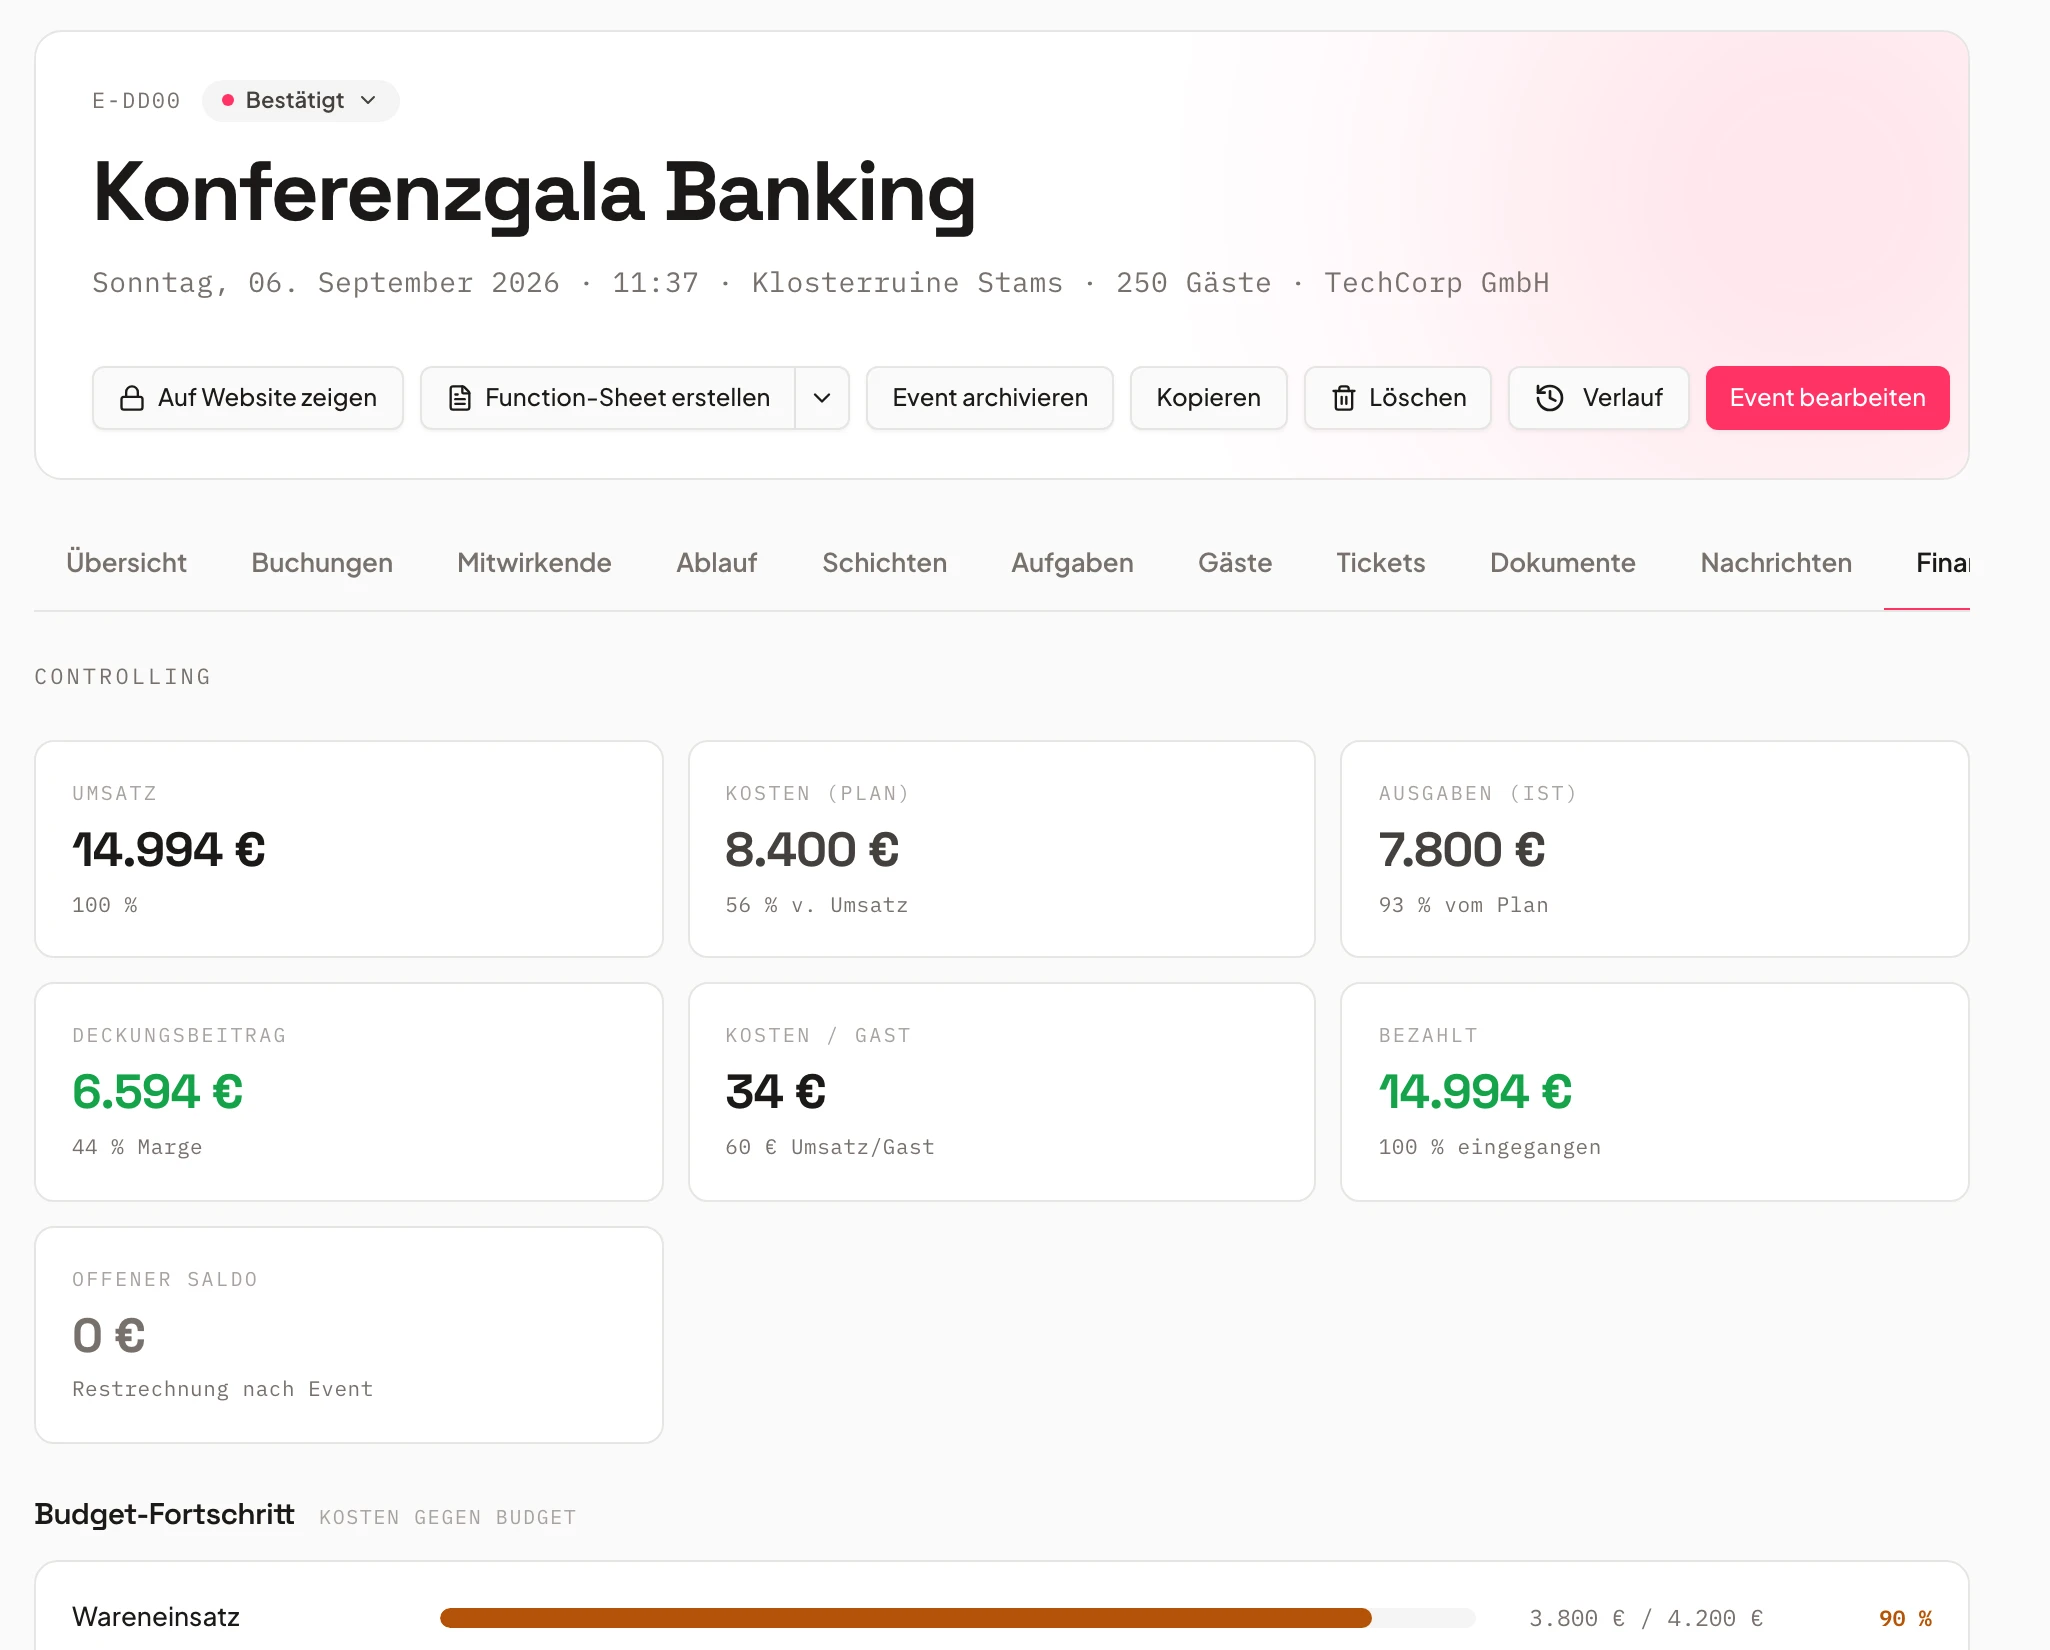
The food-cost report compares revenue, food cost and staff cost per event – the post-event calculation shows the actual contribution margin.
No more reconciling the original calculation against reality in separate spreadsheets.
- Revenue, food cost and staff compared
- Actual contribution margin per event
- Straight from invoice, stock and shift plan
- Revenue€18,400
- Food cost€6,200
- Staff€4,100
Learn from post-event numbers for the next plan
The report gives you the numbers, your team makes the rule.
The event margin report and the food-cost report show, for every past event, how much staff, stock and cost it actually took – compared with the original calculation.
From similar past events you derive your own staffing ratios and planning rules – and carry them into the next event's shift plan yourself.
- Actual staff and stock use per event
- Derive your own staffing ratios from history
- Carry into the next plan yourself
- 1Post-event calculation created
- 2Comparison event marked
- 3Staff need suggested
Frequently asked questions
How can caterers reliably forecast demand and staffing without AI planning tools?
By using their own historical event data: the event margin report, the food-cost report and the staff report with surcharges show how much staff and stock a similar past event actually needed. You use those numbers to derive your own staffing ratios and planning rules for the next event – traceable from real booking and shift data instead of a forecasting model.
Which reports does Univents offer for caterers?
The cockpit shows key figures across all events, plus revenue reports with period comparison, the event margin report for contribution margin per event, the top-customer report and the food-cost report. For staff there's a dedicated staff report with surcharges for night, Sunday and public-holiday work, plus payroll export.
How does this concretely help with staff scheduling?
The event margin and food-cost reports show you the actual staff and stock use of similar past events, including surcharges from the staff report. You use those numbers to derive your own staffing rule and carry it into shift planning and the time-balance overview in the staff module yourself.
Do I still need spreadsheets for staff and demand planning?
No. Revenue, margins, food cost and staff cost already live in Univents because they come from the same bookings, invoices and shifts. Reports can be exported, but ongoing analysis and comparison with past events happen directly in the cockpit.
What's the difference between Univents and AI forecasting tools for staff planning?
Univents doesn't predict demand from a model – it makes your own real event data analyzable: who booked what and when, what it cost, how much staff was deployed. Every number in the report traces back to a single event – traceable instead of a black box.
Ready to get started?
Try Univents for free and see how simple event management can be.
Univents newsletter
Product news and practical tips for event and catering businesses. Roughly once a month, no more.