

Booking Funnel: From View to Deal
After reading this, you'll know how the Booking Funnel tracks your booking-page visitors through to an accepted quote, what the response-time metrics mean, and how to filter by booking page and date range.
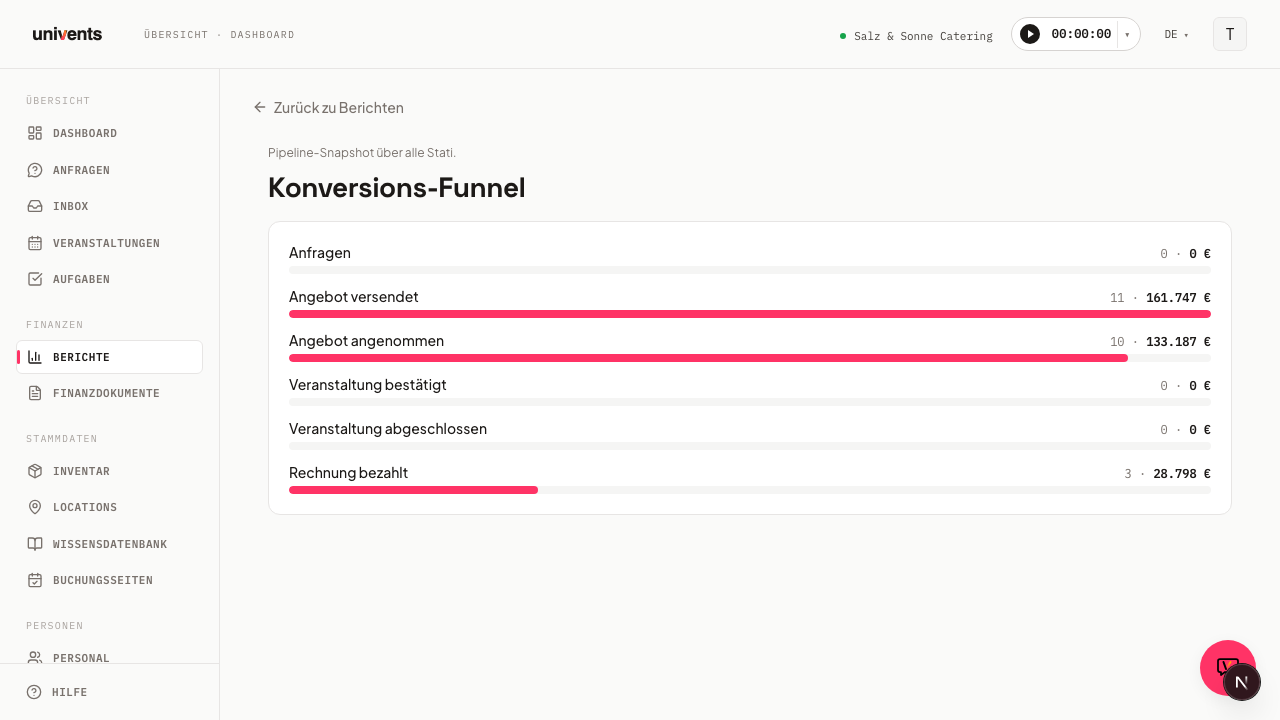
Note for existing users: This article used to be titled "Conversion Funnel" and covered a six-stage pipeline report from inquiry to paid invoice. That report no longer exists — it has been replaced by the Booking Funnel, which instead tracks the path from the first view of your booking page to an accepted quote, including response times. If you had the old page bookmarked at /berichte/konversion-funnel, there is no automatic redirect anymore — navigate there via Reports as described below instead.
The Booking Funnel shows you how many visitors to your booking pages ultimately turn into an accepted quote — and how long you and your customers take for each step in between.
Opening the report
- Click Reports in the left navigation.
- Click the Booking funnel card.
The report opens by default with the current calendar year as the date range. Use the Back to reports link (top left) to return to the reports overview at any time.
The seven stages
The report shows seven stages in sequence as bars. Each row shows the stage name, the absolute count, and two percentages: the share of the largest stage, and — from the second stage onward — the share relative to the immediately preceding stage in parentheses.
| Stage | What it shows |
|---|---|
| Views | Page views of your booking pages |
| Form started | Visitors who began filling out the booking form |
| Submitted | Visitors who submitted the form |
| Inquiries | Inquiries that resulted from those |
| Quote created | Inquiries for which a quote has already been created |
| Quote sent | Quotes that have been sent to the customer |
| Quote accepted | Quotes the customer has accepted |
Bar length always shows the ratio to the largest stage — usually Views.
Views and form starts have only recently started being tracked. For periods before this rollout, these show zero; in that case the report scales the bars relative to the first stage with actual values (usually Inquiries) and shows a note at the top that no view data exists yet for the selected period.
Response times
Below the stages, Univents shows three metrics:
- Median time to first response — how long a prospect waits, on median, for the first sign of life. Shown in hours, and in days from a full day onward.
- Median inquiry → quote — the median time it takes you to create a quote after an inquiry.
- Median sent → accepted — the median time your customer takes to accept a sent quote.
What counts as a first response
The first response is the earliest of these four moments:
- You opened the inquiry in the inquiry inbox.
- Someone on your team left an internal comment on the inquiry.
- A quote for the event was sent.
- The status of the inquiry was changed.
So if you respond simply by opening the inquiry, that moment counts — even if the quote only goes out days later.
Why creating a quote doesn't count: Univents automatically creates a draft quote for every incoming inquiry so you don't start from scratch. That draft appears at the same moment as the inquiry — if it counted as a response, the tile would read close to zero for every business. So on the quote side, only sending counts: the moment someone actually acted.
Directly below the figure, Univents shows how many inquiries in the period received no response at all. Those inquiries are deliberately excluded from the median: including them with a made-up value would distort it, and dropping them silently would flatter it. Always read the two numbers together — a median of two hours says little when "40 inquiries with no response" sits next to it.
These figures are only meaningful for newly received inquiries. Migrated legacy data carries the timestamp of its import, not the original inquiry or quote date — which would distort the median. Univents explicitly flags this in the report.
The "By booking page" table
Below the funnel stages, Univents lists the same figures broken down per booking page:
| Column | Meaning |
|---|---|
| Booking page | Name of the booking page |
| Inquiries | Number of inquiries received via this page |
| Quote | Number of quotes created from them |
| Sent | Number of quotes sent |
| Accepted | Number of quotes accepted |
| Conversion | Accepted quotes relative to this page's inquiries |
This table always shows every booking page, regardless of the selected booking-page filter — it's also the source for that filter's option list.
Filtering and exporting
- Booking page — a dropdown at the top of the report narrows the funnel stages and response times to a single booking page. There's deliberately no location or tag filter here: those would link inquiries to the event that later resulted from them and artificially inflate conversion, since inquiries that never converted would drop out of the picture.
- From/To — the date filter narrows to any date range.
- Views — saves the current combination of date range and booking-page filter under a name to reload later.
- Excel export — downloads the report for the selected date range as an Excel file.
Frequently asked questions
What happened to the old Conversion Funnel (inquiry to paid invoice)? It has been fully replaced by the Booking Funnel. The new report starts one step earlier — at the booking-page view — and ends at the accepted quote instead of the paid invoice. If you want to know how many confirmed or completed events and paid invoices result from your pipeline, use the Event and Customer/Product views in Financial breakdown.
The report is empty — what's wrong? There are neither views nor inquiries for the selected period. Adjust the date range or the booking-page filter.
Why are Views and Form started 0 even though I already have inquiries? These two stages have only recently started being tracked. There is no data for older periods — the later stages (Inquiries through Quote accepted) aren't affected by this.
Why do the two percentages per stage differ? The first figure shows the share of the largest stage (usually Views), the second — in parentheses — shows the share relative to the immediately preceding stage. This way you see both the overall conversion and where between two neighboring steps most inquiries are lost.
Can I filter by date range and booking page? Yes. Unlike the former Conversion Funnel, the Booking Funnel supports both a freely selectable date range and a filter for a single booking page.
Can I export the report? Yes, via the Excel export button at the top of the report.