

Revenue per Month (now in Financial breakdown)
After reading this, you'll know that the 'Revenue per Month' bar chart has been replaced by the Period view inside Financial breakdown, and how to find the same figures there.
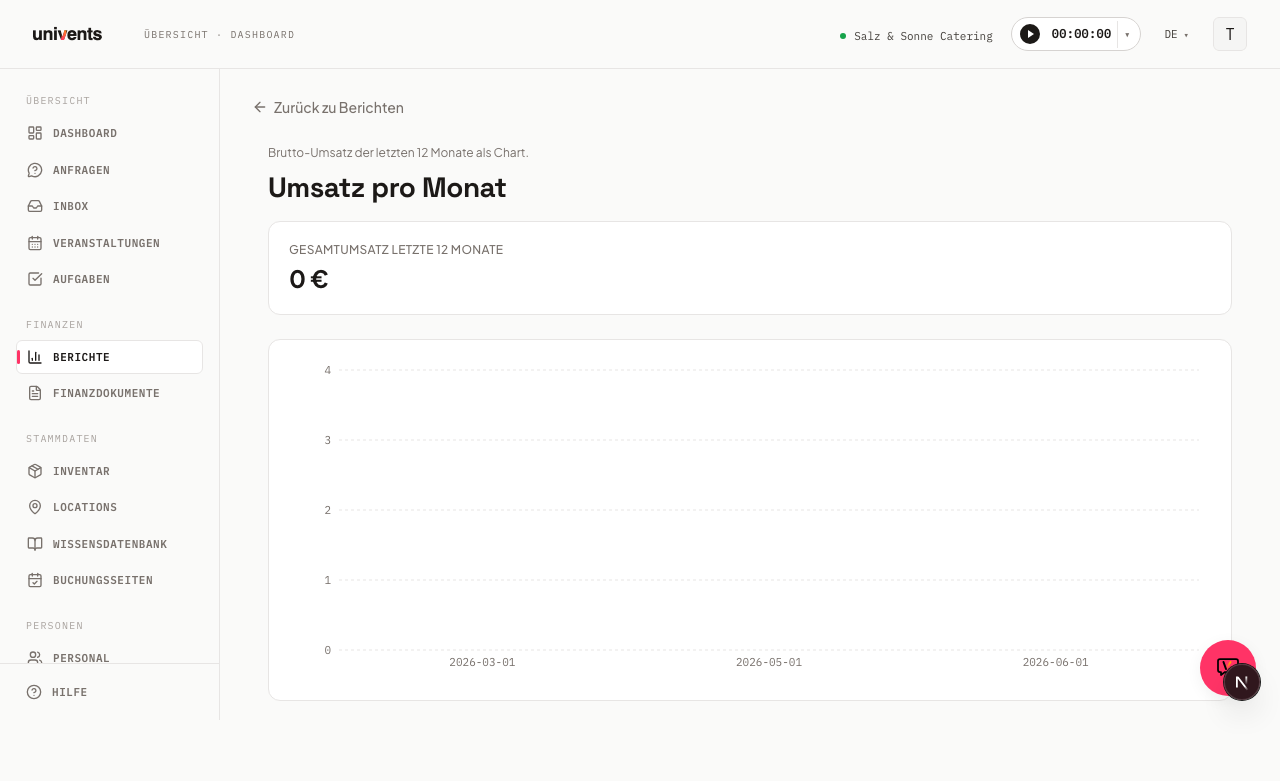
The standalone Revenue per Month report with its bar chart no longer exists as its own page, and it no longer has its own tile in the Reports hub either. The "revenue per month" figure is now part of Financial breakdown — specifically, its Period view, grouped by Month. If you open an old link or bookmark to this page, Univents automatically redirects you there.
Opening the report
- Navigate to Reports in the left-hand menu.
- Click the Financial breakdown card.
- The Period view is already selected. Below it, set Grouping to Month if it isn't already active.
Use the Back to reports link (top left) to return to the reports overview at any time.
What you see today
Instead of a bar chart with a hover tooltip, the Period view shows four summary cards — Revenue, Costs, Margin, and Events — followed by a table with one row per month (or quarter/year, depending on the selected grouping).
The key difference from the old chart: the date range is now freely selectable and no longer fixed to the last 12 months. You can also filter by location, customer, status, and guest count, compare against the previous period, and save the current configuration as a view.
For a detailed description of the metrics, columns, and filters, see Revenue by Period (Month/Quarter/Year) and Financial breakdown by period, event & category.
Frequently asked questions
Where did the bar chart go? It was replaced by the tabular Period view inside Financial breakdown. The underlying numbers are the same — you just see them as a table with summary cards instead of a chart, but now with a freely selectable date range and additional filters.
I have an old link to "Revenue per Month" saved. Does it still work? Yes. Univents automatically redirects you to the Period view inside Financial breakdown.
How do I get back to a fixed 12-month view like before? Set From in the date filter to the first day eleven months ago and To to today, and set the grouping to Month.
I need a breakdown by category, customer, or product. In Financial breakdown, use Group by to switch to the corresponding view — your selected date range is preserved.